Thursday, August 1, 2024

Commentary for July, 2024

Hello all - we hope your July was a nice one.

The markets started the month strongly, but later declines saw stocks close the month relatively unchanged.  The major indexes again saw a wide divergence in performance, with the Dow up 4.4%, the S&P 500 rose 1.1%, and the Nasdaq, which has a higher concentration of tech stocks, was lower by 0.8%.


Here’s a look at how the markets moved this month:


Here’s a look at how the various sectors performed.  Notice how many of the sectors performed well?  And notice how poorly the market return was for the month…


Volatility in the markets ticked up sharply this month.


____


July was a very odd month for the markets.

We’ve commented for many months about how unhealthy the market was.  A handful of very large companies – all tech companies – are driving the direction of the market.   Microsoft, Apple, and Nvidia alone make up more than 20% of the S&P 500 index. When these stocks go up, the market goes up.  However, this month we saw that the opposite is true.  
 
Investors sold out of these high-flying stocks and put money into the other stocks that have not performed as well.  The stocks of these tech names fell sharply and that  caused the overall market to also fall sharply several times this month.  It was odd because while these tech names were all lower, the rest of the market was green.

Below is an image of a heatmap from just one day, showing what stocks are up and the ones that are down.  We see red in the big tech names, but green in most other names.  We can see how big hose red boxes are, though, which shows how much impact they have on the overall market.


We didn’t find the declines in the markets very concerning.  The money didn’t leave the market – it just rotated into other areas of the market didn’t perform as well.  We see that as healthy.

We’ve talked about the “equal-weighted” index before.  It looks at the S&P 500, but it gives every stock the same weighting.  This index performed very well this month, showing a healthy market.


Small stocks did very well, too, as a lot of new money moved into smaller companies that have lagged behind the overall market.  The Russell 2000 Index of small cap stocks saw a gain of about 10% this month.


____

INSIDER SELLING

One interesting note has been the amount of corporate insiders (like executives and board members) who have been selling rapidly recently.  Its always good to be aware of what the insiders are doing. 


____

EARNINGS

We’re about halfway through earnings season as companies release their results from the latest quarter.  

Earnings have actually been pretty good.  Companies are on track to see their earnings grow 9.6%, which is above the original estimate of about 8.8%.  Additionally, revenue (what the company makes before the costs are subtracted) has grown by 5%.  These are pretty solid numbers.  

However, the market has not been very generous in rewarding the good results.  There remains concerns about slowing growth in the coming quarters as more companies warn about a slowdown in sales as higher costs leave shoppers with less money to spend.  

____

FED

The Fed held another policy meeting this month and announced no changes to their economic policy right now, as expected.  

However, they did seem to lay the groundwork for a rate cut at their next meeting in September.  A rate cut acts like a stimulus for the economy because it lowers borrowing costs so people and governments can borrow more money to buy more “stuff.”  The markets like stimulus and rose as a result. 


____


INFLATION

Let’s look at the inflation data from this month.  

The annual inflation level saw a nice improvement this month as inflation ticked lower.  For the first time in four years, there was a month where inflation actually declined! 


Here’s a look at the monthly chart, where we can see that monthly decline in inflation.  I guess we can actually call it “deflation.” 


It was also a lower level of inflation when excluding energy and food from the calculation, (which economists call the “core” measurement). 


The PPI, which is the inflation at the business level before they pass on the price increases to us, was the outlier and it showed an increase in inflation.


____

ECONOMIC DATA

Economic data released this month was mixed, but leaned negative.

We’ll start with the leading economic indicators, which we’ve talked about for many months.  This index combines several indicators that tend to signal the direction of the economy (like weekly unemployment numbers, building permits, etc.).  

This index had been lower for 22-straight months before finally turning higher four months ago.  Unfortunately, the positive report is looking like a one-off, as the index continues to deteriorate.  This report is a good recession indicator, so it is an important one to watch. 


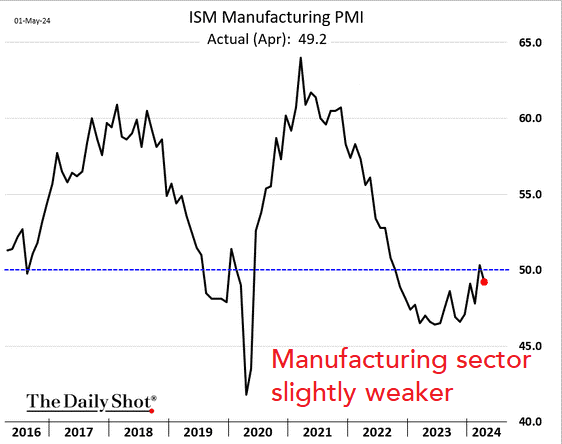
The manufacturing part of our economy was looking like it was improving; however, the last three months showed a decline as it moved back into contraction territory (a number below 50 indicates contraction).

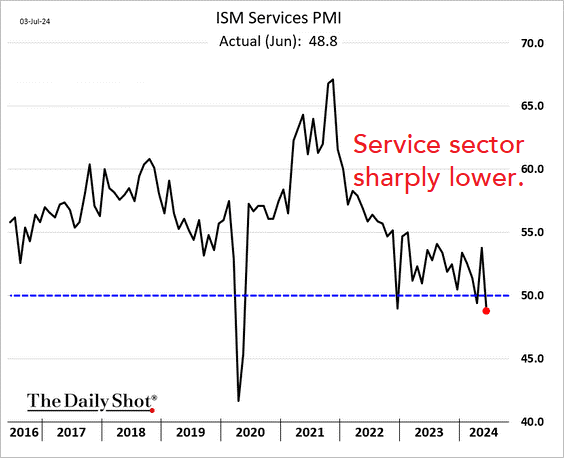
The services sector showed a surprisingly sharp drop, too.


Retail sales were exactly flat on the month.


Durable goods (these are items with a longer life, like a phone or refrigerator) showed a nice improvement. 


Consumer confidence moved slightly higher:


Small business optimism moved slightly higher, too:


____


Where does the market go from here?

We reached very oversold levels in the last week of the month, and it was a good time to do some buying as the market rebounded quickly from those lows.  It looks like there could be some more room for markets to run higher.


This commentary is for informational purposes and is not investment advice, an indicator of future performance, a solicitation, an offer to buy or sell, or a recommendation for any security. It should not be used as a primary basis for making investment decisions. Consider your own financial circumstances and goals carefully before investing. Past performance cannot guarantee results.

Sunday, June 30, 2024

Commentary for June, 2024

Hello all - we hope you had a nice June.  Hard to believe half the year is already over.    

The markets started the month strongly and stayed roughly flat for the latter half.  The major indexes again saw a wide divergence in performance, with the Dow up 2.6%, the S&P 500 rose 3.6%, and the Nasdaq, which has a higher concentration of tech stocks, was higher by 4.7%. 


Here’s a look at how the markets moved this month:


____


It’s a very strange market right now, where a small amount of very large stocks are driving the direction of the overall indexes.  

The AI darling Nvidia now makes up about 7% of the S&P 500 Index.  Microsoft and Apple are also at about 7% each.  These big stocks have performed very well, carrying the market gains.  The rise in Nvidia alone this year has accounted for about 30% of the S&P’s gains for the year.  

This chart shows how the S&P has been following the moves of Nvidia.


The rise in these big stocks has masked what has otherwise been a mediocre market.  In fact, 40% of the stocks in the S&P 500 are actually lower for the year.  

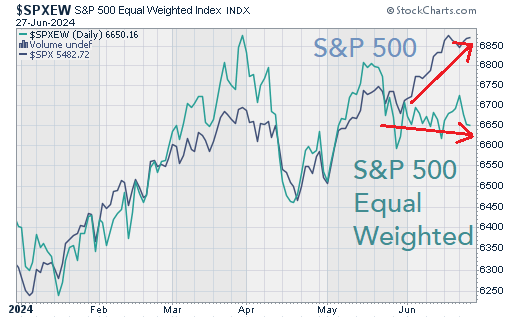
When we look at the S&P 500 with all the stocks at the same weighting, we can see how different the index looks. 


This is not a healthy market.  

____

FED

The Fed held a policy meeting this month and announced no changes to their economic policy, as expected.  However, fewer of the Fed members think they will lower interest rates this year.  Lower rates have helped stock prices, so the news was not welcomed warmly by investors.


____

INFLATION

Let’s look at the inflation data from this month.  

The annual inflation level ticked slightly lower in the most recent report, but that rate hasn’t moved much in the past year (the gray line). 


We think the monthly inflation chart is more important.  The monthly inflation rate has remained stubbornly higher for years now and this month, it rose just 0.006% - so let’s call it flat.  

The reason for the lower inflation level this month was entirely due to lower gas prices.  Gas prices have risen again this month, however, so it’s unlikely it will be helpful for the next inflation data release.

The chart below is very busy, but it shows all the different components making up the inflation level.  The black line shows the overall monthly level.


It was a milder print for monthly inflation when excluding energy and food from the calculation, (which economists call the “core” measurement), but it still shows an increase. 


The PPI, which is the inflation at the business level before they pass on the price increases to us, showed a welcomed decline last month.   


____

ECONOMIC DATA

Economic data released this month was mixed.

We’ll start with the leading economic indicators, which we’ve talked about for many months.  This index combines several indicators that tend to signal the direction of the economy (like weekly unemployment numbers, building permits, etc.).  

This index had been lower for 22-straight months before finally turning higher three months ago.  Unfortunately, the positive report is looking like a one-off, as the index continues to deteriorate.  This report is a good recession indicator, so it is an important one to watch. 


The manufacturing part of our economy was looking like it was improving; however, the last two months showed a decline as it moved back into contraction territory (a number below 50 indicates contraction).

The services sector showed a nice improvement, though.


Retail was an interesting story this month.  The level of retail sales showed a positive gain last month, but there are many warning signs.  


Many retail companies are warning that their sales are slowing as the higher prices continue to hurt shoppers and debt levels keep rising.

From Bloomberg:


As an example, Walgreens cited a tough consumer environment and troubling high prices, which is forcing them to close many of their stores.  We’re hearing this story more and more.


Durable goods (these are items with a longer life, like a phone or refrigerator) was slightly lower. 


Consumer confidence moved slightly lower:


Small business optimism moved slightly higher, however:


____


Where does the market go from here?

It’s hard to tell at this point.

The market, when including the high-flying tech names, looks a little expensive here (overbought).  When excluding those names, the market looks a little more reasonable.  Its hard to tell if the rest of the market will catch the high-fliers, or the other way around.  We don’t have a lot of conviction either way.


This commentary is for informational purposes and is not investment advice, an indicator of future performance, a solicitation, an offer to buy or sell, or a recommendation for any security. It should not be used as a primary basis for making investment decisions. Consider your own financial circumstances and goals carefully before investing. Past performance cannot guarantee results.

Monday, June 3, 2024

Commentary for May, 2024

Hello all - we hope you had a nice May.  

The markets started the month strongly, with bad economic news helping markets higher.  Bad news is good news for stocks, since it means the Fed would be more likely to help markets with more stimulus from lower interest rates.  

However, the Fed members were out in force this month saying they don’t see a rate cut any time soon.  This put a damper on the excitement and stocks fell as a result.  

The major markets saw a wide divergence in performance, with the Dow up 2.3%, the S&P 500 rose 4.8%, and the Nasdaq, which has a higher concentration of tech stocks, was higher by 6.9%. 


Here’s a look at how the markets moved this month:


Here’s a look at how the various sectors performed this month:


The big names continue to get bigger and make up more of the S&P 500 index.  The chart below shows how large the top-four names have become.  It’s been decades since we’ve seen concentration like this, and it usually doesn’t end well.


Those big names are very popular because they have performed very well recently.  Nvidia, for example, is up 25% this month.  That’s incredible!  

When those big names perform well, it makes the indexes look better than they probably are.  When we look at the index with all 500 stocks balanced to be the same size (they call this “Equal Weighting”), we can see how poorly the market has performed recently. 


____

ECONOMY

You’ll notice that the big, top-performing stocks are tech stocks.  The tech sector has done very well, but the market and economy are more than just tech stocks.  We think the strength of tech may be masking underlying weaknesses in the broader economy.

To prove this, we look at the retail sector.  The retail sector ETF (ticker RTH) holds stocks like Amazon, WalMart, CVS, etc.  It gives insights into how the businesses who sell everyday items to customers are actually doing.  

While the markets are higher on the month, the retail sector ETF is lower.  Thihs is a red flag signaling weakness in the economy.  

A chart makes this easier to see.  Below is a look at the retail ETF (the black line), and we can see how much it has underperformed tech stocks (the gold line).


We think the rising prices that everyday Americans face is causing this stress.  Costs keep rising and people can’t keep up with the price increases.  A rise in credit card defaults is evidence of this. 


We think this is a bad sign.  Prices tend to rise strongly before recessions hit.  While recessions are painful, they are necessary in correcting market imbalances and it’s the only way we’ll see prices come down.  We worry we may be creeping towards that breaking point.   

____


CORPORATE EARNINGS

Despite our concerns, corporate earnings continue to do well.  

With earnings for the first quarter largely in for all companies in the S&P 500, earnings have risen about 6%.  This is the best quarter in two years. 


We think much of the increase in earnings is actually from inflation (or is causing inflation, depending on how you look at it).  Companies are selling fewer products or services, but they have raised prices so high and that allows them to earn more.  This trend doesn’t usually last long and ends badly.  

____

INFLATION

Let’s look at the inflation data from this month.  

The annual inflation level ticked slightly lower in the most recent report, but that rate hasn’t moved much in the past year (the gray line). 


We think the monthly inflation chart is more important.  While the press likes to talk about how the inflation rate has come down, the monthly chart shows that inflation continues to rise every month.  One month builds on every month before it, which is why you’re seeing real concerns about high price levels and a struggling consumer. 


Even worse, when excluding energy and food from the inflation calculation, (which economists call the “core” measurement) inflation is solidly rising every month.


The PPI, which is the inflation at the business level before they pass on the price increases to us, showed another increase last month.   


____


OTHER ECONOMIC DATA

Economic data released this month was mostly lower.

We’ll start with the GDP report for the first quarter, which shows the strength of the economy.  The number was originally released last month, but this month it was revised lower.  The chart below shows how the data has been trending lower. 


Next, we’ll look at the leading economic indicators, which we’ve talked about for many months.  This index combines several indicators that tend to signal the direction of the economy (like weekly unemployment numbers, building permits, etc.).  

This index had been lower for 22-straight months before finally turning higher two months ago.  Unfortunately, the positive report is looking like a one-off, as the index continues to deteriorate.  This report is a good recession indicator, so it is an important one to watch. 


Here are the various indicators used in the leading indicator index:


Last month the manufacturing sector of our economy turned the corner and was no longer contracting (a number below 50 indicates contraction). Unfortunately, it dipped into contraction again this month.  

The services sector also dipped into contraction.


Retail sales declined:


Durable goods (these are items with a longer life, like a phone or refrigerator) was the one positive economic indicator we follow. 


Consumer confidence moved slightly higher:


Small business optimism moved slightly higher, too:


____


Where does the market go from here?

The month closed out at an interesting point.  Stocks are oversold on a short-term basis and look ready to rebound.  We actually saw a lot of stocks moving higher, with good volume indicating solid buying interest.

The problem is what we discussed earlier in this commentary – a few large stocks are making up a larger part of the index.  These tech stocks saw weakness at the end of the month and that’s kept the overall market from rising.  

We need to see these tech names move higher if we want the indexes to move higher, too.  


This commentary is for informational purposes and is not investment advice, an indicator of future performance, a solicitation, an offer to buy or sell, or a recommendation for any security. It should not be used as a primary basis for making investment decisions. Consider your own financial circumstances and goals carefully before investing. Past performance cannot guarantee results.