
Hello all, we hope you had a nice April.
It was another nice month for the markets as the major indexes returned near 4% or higher. That gain has helped make the first four months of 2019 the best start to a year since 1999.
It was another nice month for the markets as the major indexes returned near 4% or higher. That gain has helped make the first four months of 2019 the best start to a year since 1999.

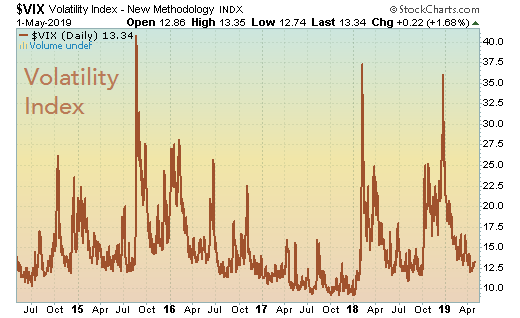
The rise in the markets this month was slow and steady, with stocks trading in a smaller daily range.

This has caused the volatility index to drop further this month, too.
_____
Why are markets rising? Fundamentals look solid – corporate earnings have been good, economic data continues to impress, and it looks like the Fed won’t be pulling back on its stimulus any time soon.
First, corporate earnings.
The bar for earnings was set very low this quarter. With double-digit earnings growth since 2017 (and over 20% growth the last two quarters), earnings growth had to take a breather at some point.
Coming in to earnings season, analysts were predicting a negative quarter. We’re about halfway through earnings reports for the first quarter right now and earnings growth looks flat to only slightly lower. While that’s nothing to get excited about, it’s better than a solidly negative number the analysts expected.

While earnings are flat, revenue (what a company earns through sales) is on pace to grow over 5% according to Factset.

Stocks have also been helped by solid economic data. Most economic reports out over the last month pointed to continued economic growth. The GDP report was surprisingly strong, too.

Employment is also a bright spot as job gains continue.

With all the good news in the markets and economy, you would think the Fed would be eager to pull back on its stimulus. After all, you shouldn’t need stimulus if conditions are so good.
However, their recent comments indicate that that they have no intention of pulling back any time soon. The odds of an interest rate hike this year are minimal while the odds of a rate cut (or more stimulus) is rising!
However, their recent comments indicate that that they have no intention of pulling back any time soon. The odds of an interest rate hike this year are minimal while the odds of a rate cut (or more stimulus) is rising!

While it might sound silly to add more stimulus at this time, it may actually be the prudent thing to do.
A recession indicator we look at is the level of the yield on the 2-year bond compared to the rate the Fed has set as its target interest rate. As you can see in the chart below, every time the Fed’s rate was higher than the 2-year bond yield, a recession followed. This occurred recently.
A recession indicator we look at is the level of the yield on the 2-year bond compared to the rate the Fed has set as its target interest rate. As you can see in the chart below, every time the Fed’s rate was higher than the 2-year bond yield, a recession followed. This occurred recently.

If this indicator is any clue, the Fed needs to cut rates now to prevent a recession down the road.
_____
What does the market do from here? Stocks have risen more than 20% since their lows in late December and can’t keep rising forever. Nearly all of the indicators we follow show the market being overbought (or expensive) in the short term. That doesn’t mean stocks can’t keep rising from here, but there is more risk to the downside than upside.

While we don’t see big gains in the near future, we aren’t seeing any red flags that often appear before a big decline, either.
So the bottom line is, stocks appear to be a little on the expensive side and we aren’t enthusiastic about putting new money in here. We aren’t doing any selling, but not actively buying, either.
This commentary is for informational purposes and is not investment advice, an indicator of future performance, a solicitation, an offer to buy or sell, or a recommendation for any security. It should not be used as a primary basis for making investment decisions. Consider your own financial circumstances and goals carefully before investing. Past performance cannot guarantee results.