Thursday, November 30, 2023

Commentary for November, 2023

Hello all - we hope you had a nice November.  

Finally, a nice month for investors!  All three indexes turned in their best months in over a year.  For November, the Dow rose 8.8% to close at its highest level of the year.  The S&P 500 gained 8.9%, and the Nasdaq, which has a higher concentration of tech stocks, added a solid 10.7%.


Here’s a look at how the markets moved this month:


A significant amount of the gain in the market has come from only a handful of stocks.  The top seven stocks in the S&P 500 have gained about 80%, while the remaining 493 stocks have gained about 6%.  This has been a very concentrated rally, which isn’t very healthy. 


Bonds were again a big story this month.  For the last few months, they were a big story because bond yields were rising at a record pace, meaning it was rapidly becoming more expensive to borrow money.   

This month, however, bonds reversed course sharply.  Yields dropped and bond prices rose. 


When bond yields fall, bond prices rise.  For investors in bond index products, like bond ETF’s, that means the ETF price moved higher.  Here’s a look at the price the most popular bond ETF, the Vanguard Total Bond Index:


____

FED

So why the reversal in stocks this month?  There are a couple things we could point to like decent corporate earnings or economic data that still looks good.  However, the biggest reason for the gains is the Fed.

Investors believe the Fed is done raising interest rates.  At least, that was the main takeaway from a Fed policy meeting at the beginning of the month.  That gave investors the green light they had long been looking for and markets shot higher.  

____

INFLATION

Inflation has been helping the Fed, too, as inflation has moved lower.  On a year-over-year measurement, inflation moved lower again this month after being flat or higher the previous three months.    


Inflation is trending lower on a monthly measurement, too.


Inflation at the business level was negative last month, which is a positive sign. 


____


OTHER ECONOMIC DATA

The economy remains in a weird spot.  Economic growth continues to look fine.  GDP has been solid and employment figures still look decent.  

Many commentators are calling this a “soft landing.”  There was a worry when the Fed stopped its stimulus that the economy would crash, or have a “hard landing.”  Obviously that hasn’t happened, hence the phrase “soft landing.” 


However, we think it’s too early to think we are in the clear.  For months we’ve shown many economic indicators that only happen in recessions.  We have a few new ones this month.

First is a chart of Gross Domestic Income (or GDI).  Without getting too far into the weeds, it’s like GDP, but it measures the income that is earned in getting GDP.  You can make GDP look better through government spending, but that isn’t possible with GDI.  

Anyway, real GDI recently turned negative and it only does that in a recession (in the chart, the periods that are recessions are marked with the gray shading).


Another red flag comes from the Beige Book, which is a way the Fed gauges economic activity.  A Beige Book indicator turned negative and only does that during recessions. 


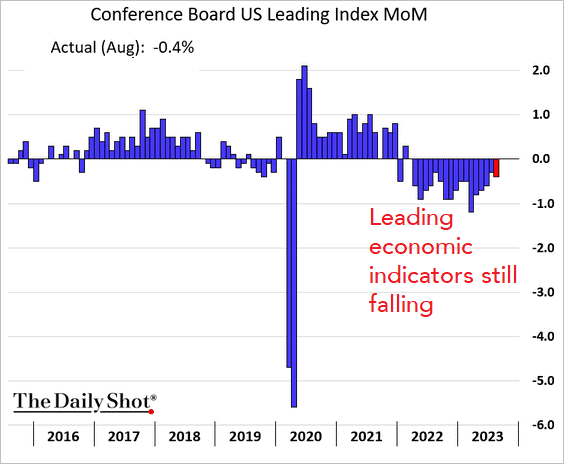
Then there is the leading economic indicators, which we’ve talked about for months.  This index combines many other indicators that tend to signal the direction of the economy (like weekly unemployment numbers, building permits, etc.).  

This index has been lower for 19-straight months now.  It has never gone this low without a recession following.


Here are the various indicators used in the leading indicator index:


The strength of the manufacturing and service sectors of our economy had been improving, but both turned lower in the most recent data. 


Retail sales were lower last month:


Durable goods (these are items with a longer life, like a phone or refrigerator) were down, too.


Amid all the negative data, consumer confidence moved higher:


Small business optimism was slightly lower, though:


____


Where does the market go from here?

Stocks were very oversold (cheap) at the beginning of the month, only to move to very overbought (expensive) levels here.  This is usually not a good time to put new money in the market.

That said, this is a very peculiar time of the year.  Money tends to flow into the market at the end of the year and push stocks higher.  You can see this in the chart below (the light blue line is the average of the market since 1950). 


The green light from the Fed earlier this month likely encourages more new money into the market, too.  

So, while we think stocks are very overbought, it’s possible they could rise into the year end.  However, we’d prefer to wait for better buying opportunities.  


This commentary is for informational purposes and is not investment advice, an indicator of future performance, a solicitation, an offer to buy or sell, or a recommendation for any security. It should not be used as a primary basis for making investment decisions. Consider your own financial circumstances and goals carefully before investing. Past performance cannot guarantee results.

Wednesday, November 1, 2023

Commentary for October, 2023

Hello all - we hope you had a nice October.  

Unfortunately, it was another bad month for the markets.  Actually, stocks started out solidly, but reversed course later in the month to close in the red.  The Dow fell 1.3%, the S&P 500 lost 2.1%, and the Nasdaq, which has a higher concentration of tech stocks, was lower by 2.8%.  

Like last month, stocks look oversold (cheap) here and there are again reasons to be optimistic.  We’ll get into that later.


Here’s a look at how the markets moved this month:


Here’s a look at how the various sectors performed this month:


The S&P 500 is now down more than 10% from its most recent highs in July. 


The stock market remains solidly in positive territory for the year, with the S&P 500 up just over 10%.  However, that performance came from only a handful of names.  The top seven stocks saw significant gains, while the remaining 493 are barely flat on the year.

All the stocks in the S&P 500 Index have different weightings.  There might be a larger percentage of one stock and smaller amount of another.  However, if every stock  in the index was the same size (called an “equal-weighted index”), that equal-weighted index would be much lower for the year.  This can be seen in the chart below.


Bonds were again a big story this month.  Bond yields hit their highest level since 2007 (as measured by the 10-year bond), which means the cost to borrow money is extremely high. 


When bond yields rise, bond prices fall.  For investors in bond index products, like bond ETF’s, that means the ETF price moved lower.  Here’s a look at the price the most popular bond ETF, the Vanguard Total Bond Index:


These higher bond yields (or higher borrowing costs) are an important story.  They make taking on debt more costly.  

Not only is it a concern for people and businesses, but it is a serious issue for our government.  As you can see in the chart below, the debt of the U.S. continues to climb, even after the Covid spending era.  


Our country borrowed over $1 trillion last quarter (that’s $1 trillion in just three months!) – a record high amount.  This quarter they expect to borrow over $800 billion – another massive amount.  There doesn’t seem to be a reduction in the amount of borrowing further down the road, either.  This is a serious issue that must be addressed and will cause problems at some point in the future.

____

EARNINGS

Switching gears to corporate earnings for the third quarter, where the results have been mediocre.

We’re about halfway through the companies in the S&P 500 and so far, company earnings are on pace to rise about 2.7%.  This is important because it’s the first increase in earnings in a year.  

Above we mentioned how only a handful of stocks are doing well and the others are doing poorly.  The story is the same with earnings.  According to investment research firm Bernstein, the seven biggest tech stocks are expected to see their earnings grow 33%.  The other 493 companies in the S&P 500 are expected to see their earnings drop almost 9%. That’s quite a big divergence.    

____

INFLATION

Overall inflation year-over-year numbers had been moving lower for over a year, but they may be starting to bottom.  Inflation stayed flat last month after two higher months prior to that. 


That’s when looking at inflation on an annual level, too.  When you look at inflation month-by-month, inflation is still rising every month.


Inflation is also steadily rising when we exclude food and energy from the calculation (which economists call the “core” measurement). 


Inflation at the business level had been coming down, but is now rising again.


____


ECONOMIC DATA

The economy is in a weird spot right now.  

Economic growth continues to look fine.  The most recent GDP report showed a 4.9% increase, which is the highest growth rate since 2021.


However, there are many warning flags we are watching.  

One of the warnings comes from the inversion in the bond market. We won’t get into what exactly that means right now, but just check out the charts below.   Notice where the blue line dips below the black horizontal line - that indicates an inversion.   

Economists make a big deal about the inversion and how it signals a recession is near.  Actually, the real concern is when the blue line starts rising quickly higher.  That’s when recessions are near.

The charts below signal a recession is very near.


Another recession indicator is the leading economic indicators.  This index combines many other indicators that tend to signal the direction of the economy (like weekly unemployment numbers, building permits, etc.).  

This index has been lower for 18-straight months now.  It has never gone this low without a recession following.


Here are the various indicators used in the leading indicator index:


Amid our concerns, the strength of the manufacturing sector improved this month, but it continues to contract – it’s just not contracting as fast. 


The service sector of our economy dipped slightly last month, but still looks to be doing alright.


Continuing with the positives, retail sales were higher:


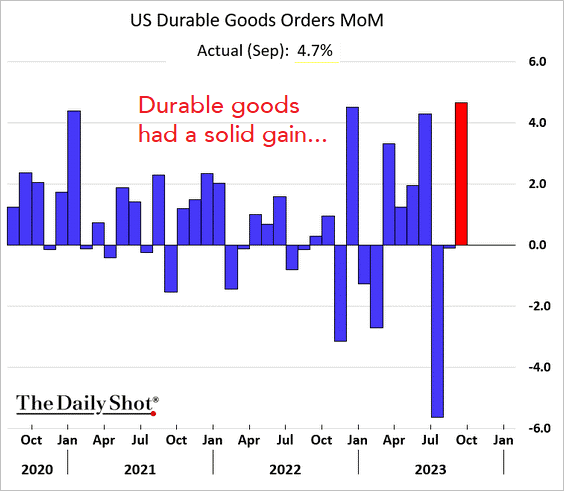
Durable goods (these are items with a longer life, like a phone or refrigerator) posted a solid gain.


...Although that gain was mostly due to some large aircraft orders.  Without that, the result was a modest increase.


The economic surveys leaned negative this month.  Consumer confidence moved lower:


Small business optimism also moved lower:


____


Where does the market go from here?

In our commentary last month, we mentioned there were reasons to be optimistic – just like we mentioned this month.  Last month stocks looked oversold and due for a bounce higher – which they did.  Unfortunately, the bounce didn’t last long and stocks eventually moved lower.

We look like we are in the same position this month.  Stocks look very oversold and due for a bounce (which we’ve already started seeing the last three days).  We think the odds of a rise are greater than a decline and now looks like a good time to buy.  


This commentary is for informational purposes and is not investment advice, an indicator of future performance, a solicitation, an offer to buy or sell, or a recommendation for any security. It should not be used as a primary basis for making investment decisions. Consider your own financial circumstances and goals carefully before investing. Past performance cannot guarantee results.

Monday, October 2, 2023

Commentary for September, 2023

Hello all - we hope you had a nice September.  

Last month we mentioned that September is historically the worst month for stocks – and it lived up to that reputation.  With the worst returns of the year, the Dow fell 3.5%, the S&P 500 lost 4.9%, and the Nasdaq, which has a higher concentration of tech stocks, was lower by 5.8%.  

While there was a lot of bad news this month, there are reasons to be optimistic and we’ll get into them later.


Here’s a look at how the markets moved this month:


Here’s a look at how the various sectors performed this month:


The stock market remains solidly in positive territory for the year, with the S&P 500 up 13%.  However, that performance came from just a handful of names.  The top seven stocks had significant gains, while the remaining 493 are barely flat on the year.

The chart below shows how large this divergence is.


Bonds were again a big story this month.  Bond yields hit their highest level since 2007 (as measured by the 10-year bond), which means the cost to borrow money is extremely high. 


When bond yields rise, bond prices fall.  For investors in bond index products, like bond ETF’s, that means the ETF price moved lower.  Here’s a look at the price the most popular bond ETF, the Vanguard Total Bond Index:


Oil has been a big story, too, as prices hit their highest level in over a year.  Oil prices have risen as our stockpiles have fallen to a 14-month low and OPEC unwilling to pump more.  Lack of supply and rising demand means higher prices.


____


INFLATION

These higher oil and energy prices have had a significant impact on inflation.  Here’s a look at how gas prices have risen over the past three years, up about 50% over that time:


Overall inflation rose again last month.  The year-over-year numbers had been moving lower for over a year, but took a turn higher for the second-straight month. 


When you look at inflation month-by-month, inflation is still rising every month.


Inflation is also steadily rising when we exclude food and energy from the calculation (which economists call the “core” measurement). 


Inflation at the business level looks to be turning the corner and is coming down, which is a good sign for us as shoppers. 


____


THE FED

Talking about inflation inevitably brings us to the Fed, who held another policy meeting this month.  They have been raising interest rates to slow inflation by slowing the economy.  

To us this makes no sense, because inflation is coming from things like higher energy prices, which the Fed can’t control.  Or supply chain issues, which the Fed can’t control.  Or businesses having to pay higher wages, which the Fed can’t control.  Or higher regulatory and insurance costs, which the Fed can’t control.  Or countless other factors the Fed can’t control.  We think squashing an entire economy is idiotic, but we think most of what the Fed does is idiotic.  

At any rate, the Fed announced no new changes to their policy at their meeting this month.  However, many investors thought the Fed would lighten up on their policy in the coming months, but they seemed to do just the opposite.  They indicated they were likely to raise interest rates even further and keep these rates high for longer than many expected.  Stocks sold off on the news.  

____


ECONOMIC DATA

Economic data wasn’t bad this month.  

A lot of investors and policy makers have been using the phrase “soft landing” to indicate that the economy isn’t heading to a recession.  This is funny because Bloomberg has found that increasing talk of a “soft landing” has always preceded a recession.


Another recession indicator is the leading economic indicators.  This index combines many other indicators that tend to signal the direction of the economy (like weekly unemployment numbers, building permits, etc.).  

This index has been lower for 17-straight months now.  It has never gone this low without a recession following.


The strength of the manufacturing sector improved this month, but it continues to contract – it’s just not contracting as fast. 


This marks the eighth month of a contracting manufacturing sector.  As we can see in the chart below, manufacturing tends to decline during global economic crises, so this yet another recession indicator. 


On the positive side, the service sector of our economy looks to be doing alright.


Continuing with the positives, retail sales were higher:


Coming off the biggest drop in three years, durable goods (these are items with a longer life, like a phone or refrigerator) posted a slight gain.


The economic surveys leaned negative this month.  Consumer confidence moved lower:


Small business optimism also moved lower:


____


Where does the market go from here?

At the beginning of this commentary we mentioned there were reasons to be optimistic.  We think now looks like a good time to buy.  Stocks are very oversold (cheap) in the short term (a few weeks), and the odds of a rise are greater than a decline.  

We are also entering a historically strong part of the year.  Yes, October can be a volatile month, but it starts a quarter that is usually very strong.


Further, the last three September’s have all fared poorly.

2020: -3.9%
2021: -4.8%
2022: -9.3%

But the fourth quarters of the last three years have been very strong.

2020: +11.7%
2021: +10.7%
2022: +7.1%

We don’t like to make investment decisions based on historical precedents, but when combining all the other factors, we think now is a good time to dip a toe in.  We would like to see some stability before buying, though.  A day or two in the green with solid buying volume is important – its not wise to try to catch a falling knife.


This commentary is for informational purposes and is not investment advice, an indicator of future performance, a solicitation, an offer to buy or sell, or a recommendation for any security. It should not be used as a primary basis for making investment decisions. Consider your own financial circumstances and goals carefully before investing. Past performance cannot guarantee results.