Thursday, August 1, 2019

Commentary for the period ending 7-31-19

Hello all – we hope you had a nice July.  It’s hard to believe we are already into August!

Stocks saw modest gains in July, extending what has so far been remarkable year.  The S&P 500 is having its best year since 1997, the Dow its best year since 2013, and the Nasdaq since 2009. 


July was mostly uneventful, too, with most of the action coming late in the month as the Fed meeting approached.  Volatility was low and stocks traded in a narrow range. 


____


The Fed was the main topic on most investors’ radar as they held their policy meeting this past Tuesday and Wednesday. 

The market was pricing in a 100% chance for an interest rate cut of 0.25% (which makes it cheaper to borrow money).  However, many investors were hoping for a bigger cut of 0.50%.  Many prominent, vocal critics were pushing for a bigger cut, too. 


As expected, the Fed did announce a cut of 0.25%, which was the first time rates have been lowered in over a decade. 


However, the market sold off sharply on the news.  Remember, some investors were hoping for more of a cut and Chairman Powell’s comments didn’t seem to indicate more cuts were coming any time soon.  This caused the negative reaction in the market. 

We believe this expectation was entirely unrealistic.  Our economy is solid and still shows growth, so the need for increased stimulus to help the economy is unnecessary.  The fact that they even cut rates was a surprise. 

Further, it’s unclear how making borrowing even easier will boost the economy.  Other countries have low rates and continue to lower them further (many have negative rates), but growth never materializes.  At what point do they conclude their remedy is not the cure?

The only reason we see a cut being justified is to placate the markets.  We’ve used the chart below many times over the past few months, which has been a reliable recession indicator. 

It compares the level of the yield on the 2-year bond to the rate the Fed has set as its target interest rate.  As you can see in the chart below, every time the Fed’s rate was higher than the 2-year bond yield, a recession followed (recessions are the gray shaded areas on the chart).  This began occurring a few months ago and continues still today.  However, the Fed lowering rates (to where the red ‘X’ is) reduces the chances of a recession. 


____


As for the economic data released this month, GDP for the second quarter came in at 2.1%, which was higher than expectations.  In the chart below, we can see how these results have been mostly steady in recent years versus the wide fluctuations in the previous years.  This shows a healthy, sustained growth in the economy. 


Consumer spending data has also seen some of the strongest numbers in a long time.  Below we can see one metric, consumer confidence, remaining near recent highs. 


Business optimism has recently taken a hit amid the rising trade tensions, but overall, small business optimism is still trending higher. 


The one concern we have is a slowdown in manufacturing.  This is likely due mostly to the trade fight, but it is something to keep an eye on. 


____


Finally, corporate earnings were another big story this month.  We are currently right in the middle of the period when companies release their results, so it may be a little early to get a complete picture. 

That said, the results so far have been better than expected.  Factset reports that analysts estimated earnings to decline 2.5% over the past year, but the results are pointing to a slight gain of 0.5%. 
____


Where does the market go from here?  Stocks still appear to be on the expensive side in the short term and the upside potential isn’t as great.  However, we don’t see the red flags that would make us overly cautious although it’s worth noting that August is traditionally a tough month for stocks.  The market often does what most investors think it won’t do. 


This commentary is for informational purposes and is not investment advice, an indicator of future performance, a solicitation, an offer to buy or sell, or a recommendation for any security. It should not be used as a primary basis for making investment decisions. Consider your own financial circumstances and goals carefully before investing. Past performance cannot guarantee results.

Sunday, June 30, 2019

Commentary for the period ending 6-28-19

Hello all, we hope you had a nice June. 

It was a very nice month for stocks, which rebounded solidly after a tough May. 

The month was actually the best July for the Dow since 1938 and best for the S&P since 1955.  Further, the S&P has had its best start to a year since 1998. 

____


Last month we mentioned how investors were leaving stocks and moving into safer investments like bonds.  This pushes bond prices up and yields down – and yields were down sharply in May.  This didn’t change much in June.  It looks like there are still a lot of worried investors who are hiding out in bonds.

____


The Fed may have played a part in investors remaining in the bond market, too.

They held a policy meeting this month and announced no changes to their policy at this time.  However, they suggested they may lower interest rates again in the coming months as a response to the trade war and weakening economic data (lower interest rates make it cheaper and easier to borrow money). 

The market loves stimulus, so stocks rose as a result.  Bond prices would rise in the event of lower rates, too, which is why some investors remained in bonds.


Not surprisingly, the odds of a rate cut have risen sharply.  The market is placing nearly a 100% chance of cuts at the Fed’s July meeting.  As you can see in the image below, many investors are predicting multiple rate cuts this year. 


As we mentioned last month, it seems absurd for the Fed to lower rates again when they are already so low.  However, market indicators suggest this is the prudent thing to do to avoid a recession. 

A recession indicator we’ve mentioned the last few months is to look at is the level of the yield on the 2-year bond compared to the rate the Fed has set as its target interest rate.  As you can see in the chart below, every time the Fed’s rate was higher than the 2-year bond yield, a recession followed (recessions are the gray shaded areas on the chart).  This occurred a few months ago and continues still today.

____


Switching gears, economic data was mostly negative this month.  They weren’t bad really, just “less good” than previous months.  However, it doesn’t take long for “less good” to turn into “bad.”

Manufacturing has been a big story as it has fallen virtually all year. 


Overall business conditions are falling, too.


This is leading to lower confidence among Americans.  Consumer confidence numbers can signal the direction of the market, so it is something to keep an eye on. 

____


One of the main culprits for the malaise is the lingering trade war with China.  There are hopes that some resolution to the fight will come from the G-20 meeting this weekend as President’s Trump and Xi meet. 

We think the chance of a deal is extremely slim and very few are predicting this.  However, we think the market will be happy if both sides leave this weekend with a positive tone.  As President Trump often says, we’ll see what happens. 

____


Where does the market go from here?  After rallying so much this month, the upside potential from here isn’t as great.  However, we don’t see a lot of red flags that would make us overly cautious.  Like with the trade deal, there are a lot of outside factors that can impact the market, but we are pretty optimistic overall. 


This commentary is for informational purposes and is not investment advice, an indicator of future performance, a solicitation, an offer to buy or sell, or a recommendation for any security. It should not be used as a primary basis for making investment decisions. Consider your own financial circumstances and goals carefully before investing. Past performance cannot guarantee results.

Monday, June 3, 2019

Commentary for the period ending 5-31-19

Hello all, we hope you had a nice May. 

The markets finally turned lower this month after solid gains in the first four months of the year.  Stocks trended lower all month and in fact, the Dow has been lower the last six weeks, making it the longest losing streak in almost eight years (the S&P and Nasdaq have been down the last four weeks).  However, these losses have been pretty mild compared to the average losses for such a long stretch of declines. 


While May was a rough month, we’re still looking pretty good looking out a little longer.  For the year, the Nasdaq is up over 12%, the S&P is up nearly 10%, and the Dow is up more than 6%.  If the year were to finish at the level, investors would probably be pretty happy. 


____

 
The unease amongst investors rose sharply this month and it is especially visible in the bond market.  Investors put money into bonds when nervous, causing bond prices to rise and their yields to fall. 

In the chart below, you can see the yields falling sharply over the last month.


The drop in bond yields was actually the trigger for some of the selloffs in stocks.  Bonds are often seen as a leading indicator, especially for the economy, so the more yields fell, the more nervous investors became.
____


What was the culprit for the decline? 

First we have to remember that the market was already on the expensive side (or overbought, in investment-industry jargon), which is something we discussed last month.  In overbought markets, investors become quick to sell at the first sign of trouble to lock in their gains. 

With that in mind, there were a couple of culprits we can point to.  First is the ongoing trade war with China as no signs of progress were made and the rhetoric gets worse. 

A new trade fight with Mexico emerged late in the month as the President added new tariffs to combat the illegal immigration problem.  This introduces a whole new level of uncertainty and the markets don’t like uncertainty. 

These items add to the worries about a slowdown in economic growth.  China has shown signs of slowing, as has Europe.  The U.S. has seen a slowdown in manufacturing, too.


An indicator we like to follow is the price of copper.  It’s used for construction and manufacturing and its price tends to be a barometer for the global economy.  As you can see, it’s declined on these trade worries.


____


Investors are very pessimistic and are increasingly hoping the Fed will step in with more stimulus.  The odds of the Fed lowering interest rates sometime this year is approaching 90%.


It seems absurd for the Fed to lower rates again when they are already so low.  However, market indicators suggest this is the prudent thing to do to avoid a recession. 

A recession indicator we’ve mentioned the last few months is to look at is the level of the yield on the 2-year bond compared to the rate the Fed has set as its target interest rate.  As you can see in the chart below, every time the Fed’s rate was higher than the 2-year bond yield, a recession followed (recessions are the gray shaded areas on the chart).  This occurred a few months ago and the trend continues.


The next chart shows the yield on the 10-year bond being subtracted from the 3-month bond yield.  When the 3-month bond yield is higher than the 10-year bond yield, a recession tends to follow. 


These charts show that the Fed needs to cut rates to prevent a recession.  It’s also a sign that is will be very tough for the Fed to get out of this massive stimulus program without any problems.
 ____
 
 
It wasn’t all bad news this month.  Economic growth is still expanding, though at a little slower speed.  Corporate earnings are decent, incomes are up, and consumer confidence remains high. 


 ____
 
With all this doom and gloom, what does the market do from here?  This selloff may provide a pretty good buying opportunity.  Several of the indicators we follow show it is a good time to buy while others suggest an opportunity may be coming soon.  That doesn’t mean stocks can’t keep falling from here, but the odds of the market going higher have risen. 


The bottom line: stocks are becoming cheap and a little nibbling on some stability in the markets (a couple days of gains) might be prudent.  It’s tough to predict, though, when a tweet has the potential to send stocks down further.


This commentary is for informational purposes and is not investment advice, an indicator of future performance, a solicitation, an offer to buy or sell, or a recommendation for any security. It should not be used as a primary basis for making investment decisions. Consider your own financial circumstances and goals carefully before investing. Past performance cannot guarantee results.

Wednesday, May 1, 2019

Commentary for the period ending 5-1-19

Hello all, we hope you had a nice April. 

It was another nice month for the markets as the major indexes returned near 4% or higher.  That gain has helped make the first four months of 2019 the best start to a year since 1999.


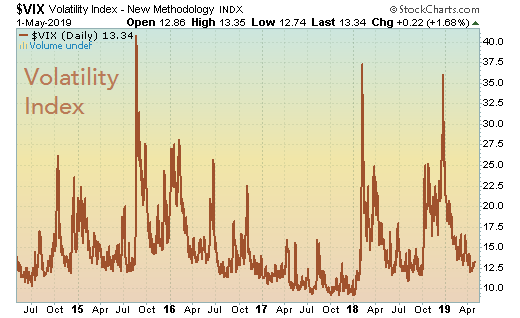
The rise in the markets this month was slow and steady, with stocks trading in a smaller daily range.


This has caused the volatility index to drop further this month, too.


_____


Why are markets rising?  Fundamentals look solid – corporate earnings have been good, economic data continues to impress, and it looks like the Fed won’t be pulling back on its stimulus any time soon.

First, corporate earnings.

The bar for earnings was set very low this quarter.  With double-digit earnings growth since 2017 (and over 20% growth the last two quarters), earnings growth had to take a breather at some point. 

Coming in to earnings season, analysts were predicting a negative quarter.  We’re about halfway through earnings reports for the first quarter right now and earnings growth looks flat to only slightly lower.  While that’s nothing to get excited about, it’s better than a solidly negative number the analysts expected. 


While earnings are flat, revenue (what a company earns through sales) is on pace to grow over 5% according to Factset. 


Stocks have also been helped by solid economic data.  Most economic reports out over the last month pointed to continued economic growth.  The GDP report was surprisingly strong, too.


Employment is also a bright spot as job gains continue.


With all the good news in the markets and economy, you would think the Fed would be eager to pull back on its stimulus.  After all, you shouldn’t need stimulus if conditions are so good.

However, their recent comments indicate that that they have no intention of pulling back any time soon.  The odds of an interest rate hike this year are minimal while the odds of a rate cut (or more stimulus) is rising!


While it might sound silly to add more stimulus at this time, it may actually be the prudent thing to do. 

A recession indicator we look at is the level of the yield on the 2-year bond compared to the rate the Fed has set as its target interest rate.  As you can see in the chart below, every time the Fed’s rate was higher than the 2-year bond yield, a recession followed.  This occurred recently. 


If this indicator is any clue, the Fed needs to cut rates now to prevent a recession down the road. 
_____


What does the market do from here?  Stocks have risen more than 20% since their lows in late December and can’t keep rising forever.  Nearly all of the indicators we follow show the market being overbought (or expensive) in the short term.  That doesn’t mean stocks can’t keep rising from here, but there is more risk to the downside than upside.


While we don’t see big gains in the near future, we aren’t seeing any red flags that often appear before a big decline, either. 

So the bottom line is, stocks appear to be a little on the expensive side and we aren’t enthusiastic about putting new money in here.  We aren’t doing any selling, but not actively buying, either.  


This commentary is for informational purposes and is not investment advice, an indicator of future performance, a solicitation, an offer to buy or sell, or a recommendation for any security. It should not be used as a primary basis for making investment decisions. Consider your own financial circumstances and goals carefully before investing. Past performance cannot guarantee results.