Tuesday, September 1, 2020

Commentary for August 2020

Hello all – we hope you had a pleasant August.

It was a great month for the markets.  In fact, it was the best August since the 1980’s.  The Dow rose 7.6% for its best August since 1984.  The S&P gained 7.0% for its best August since 1986.  The Nasdaq, which has a higher concentration of tech companies, had its best August since 2000 with a 9.6% gain.  All closed the month at or near record highs. 


Another remarkable stat is that the S&P 500 was lower only 5 days this month.  That means stocks were higher for 76% of August. That’s pretty rare.


Continuing with the 'remarkable' theme, stocks have now fully recovered from the drop that began in late February.  That’s the fastest recovery ever from a drop that big.  
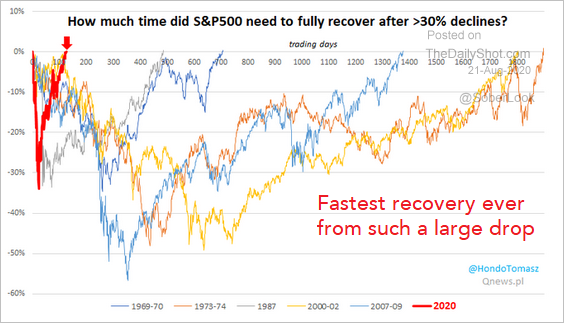


Its hard to believe the market can be doing so well when things are still pretty bad for a lot of companies.  However, breaking down the market into sectors shows us that the market is not completely irrationally.  

Some companies and sectors have been hit by the shutdowns and are doing poorly, as expected.  On the other hand, these conditions are great for other sectors - technology in particular.  This has led the overall market to record highs. 


                                                                    ____

 
It’s a similar story in the corporate world.  

Many companies are doing poorly and bankruptcies are rising, but big companies are able to find ways to adapt to these conditions.  

Online businesses like Amazon are clear beneficiaries.  But other names like WalMart, Target, and Lowe’s were able to boost their e-commerce to reach record sales.  

Here’s a look at the increase in sales at WalMart, which doubled their online sales over the past year:


Then again, these were some of the few businesses that were allowed to remain open.  With many smaller businesses required to close their doors - and many still closed today - the big names are able to reap the benefits.  

                                                                ____


Overall corporate earnings have come in far above expectations, too.  

Well, first we’ll point out that earnings are down 37%, which is a terrible number.  However, this is much higher than analysts estimated.  

According to Factset, 86% of companies either beat or met expectations, which is the best quarter since they began tracking this data in 2008.  Additionally, companies beat the expected number by 23%, which is also a record by a wide margin.  The market moves on expectations and this has been part of the move to record highs.  


                                                                     _____
 
 
Economic data has also caught economists flat-footed, coming in well better than their predictions.

Citigroup has an index we’ve mentioned here often called the Economic Surprise Index, which measures economic data in relation to its forecast.  If economic data comes in better than forecasted, the index rises.  As you can see in the chart below, it’s at a level that is head-and-shoulders above anything seen in the past 20 years.


Economic data has been decent overall.  Weekly unemployment continues to improve:


The service and manufacturing sectors are also getting stronger:


 Also, people are spending more, which has boosted retail sales and durable goods:


However, people might not be feeling too great about the economy as sentiment numbers have turned lower.  Here’s a look at small business optimism:


                                                                     _____
 
 
The Fed was also in the news this month.  We won’t spend much time on this, but they announced a shift in their official policy to accept more inflation.  It’s something they’ve openly discussed before, but appear to have officially adopted.  

We find this policy very troubling and strongly believe it will cause significant problems down the road.  In the short term, however, the markets seem to like it and have risen on the news.    

It is having an effect on the strength of the dollar, which continues to weaken. 


                                                                    _____
 
 
Lastly, the level of Coronavirus cases continues to decline, which has also helped markets this month.  We haven’t heard this mentioned in the press, however.  Instead, we hear about the cumulative total of cases or deaths hitting some “grim milestone,” but the Covid picture really is improving.  
 

                                                                        _____
 
 
Where does the market go from here?  

The market is very expensive.  Nearly all the indicators we follow are at overbought levels.  

Other fundamental metrics are high, as well.  The P/E ratio - which simply measures the price of a stock to its earnings - is at its highest level since 2002, signaling the market is very expensive.  The P/E ratio based on earnings estimates for the next year (the forward P/E) is at its highest level since 2000.  

This doesn’t mean stocks can’t keep going higher, but we think the odds of a decline are high and wouldn’t put new money in at this time.  It’s very cheap to hedge a portfolio right now and adding some downside protection may be wise here.  


This commentary is for informational purposes and is not investment advice, an indicator of future performance, a solicitation, an offer to buy or sell, or a recommendation for any security. It should not be used as a primary basis for making investment decisions. Consider your own financial circumstances and goals carefully before investing. Past performance cannot guarantee results.

Monday, August 3, 2020

Commentary for the month ending 7-31-20

Hello all – we hope you had a nice July.

The market returns this month were fairly decent, where they started off strong though they stalled in the latter half.  For the month, the Dow rose 2.3%, the S&P gained 4.5%, and the Nasdaq, which has a higher concentration of tech companies, was higher by 4.3%.


There were a few other stories in the markets worth noting.

Gold and the dollar and their relationship grabbed headlines this month.  Gold reached record highs…


…while the dollar dropped sharply.


Part of this move can be attributed to investors’ concerns with the Fed’s stimulus programs, where they are printing seemingly infinite amounts of money to finance massive debt levels.  If they are printing more dollars, it means the dollars will be worth less.  That’s good for commodities, like gold.  This has the potential to end very badly, but we don’t appear to be anywhere near that level yet. 

We look at the move in these two as a vote of confidence in the economic policy.  A weaker dollar and higher gold tells us there isn’t a lot of confidence at this time. 

____


The Coronavirus was again the main topic this month.  The amount of cases rose, which caused some volatility in the markets.  More cases meant more shutdowns and we’re already starting to see a negative impact on economic data. 

The latest surge appears to be peaking, though, and hopefully will continue to trend lower from here.   


Corporate earnings were a big story this month as the results for the second quarter started rolling in.  So far, a little more than half of the companies in the S&P 500 have reported results and they have been better than expected. 

Analysts expected to see a 44% decline in earnings over the past year, but the result has been only a 41% decline.  Estimates usually don’t miss by this much, but the difference is more of a reflection on how hard it is to make predictions in this current environment. 

Also, such a large decline is not really something to get excited about, but its not unexpected when an entire economy is shut down.

The earnings news wasn’t all bad, though, as many companies are seeing improving trends and raising their predictions for the future. 


____


Economic data released this month was a mixed bag.  Data covering the second quarter was horrible, data for the month of June (and released this month) was decent, and recent data for July shows a clear stalling. 

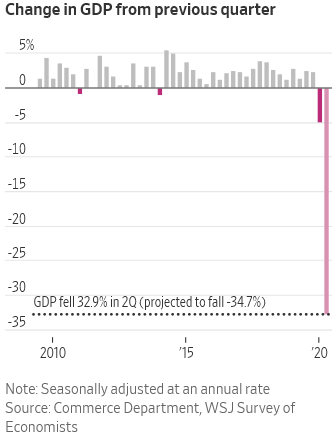
We’ll start with GDP for the second quarter, which was terrible.  GDP, which measures the strength of the economy, fell by 34.7% over the past year.


This is the worst print for GDP - ever.  Here’s a chart showing a longer view:


Despite the historic GDP decline, the results generated very little reaction in the markets.  Investors knew the number would be bad since it covered the very darkest part of the shutdown.  However, we know the economy has reopened at least partially since then and it’s likely we are past the worst of the virus. 

In fact, estimates for next quarter’s GDP look solid:


As for other economic data released this month, the results were encouraging. 

The strength of the manufacturing and service sectors rebounded sharply:


Retail sales have also sprung back:


Durable goods (which are items with a longer life, like a phone or refrigerator) look strong, as well.


However, we have to keep in mind that these reports did not include the last few weeks of July, where Coronavirus cases picked up and more shutdowns were imposed. 

The weekly employment figures showed more people filing for unemployment over the last two weeks:


We’re also seeing one of our favorite leading indicators for the economy - the amount of people dining out - starting to stall. 


While we are clearly doing better than a few months ago, the economy does appear to be stalling.  Additional or prolonged shutdowns will continue to weigh on the economy and are likely to weigh on the markets, too.

____


As we near the Presidential election, it’s worth noting that the markets are a great indicator of who will win. 

In the three months leading up to the election, a higher market is an indicator that the incumbent will win and a lower market signals an incumbent loss.  This has been true every time since 1984 and 87% of the time since 1928.  That’s a pretty solid track record!


____


Where does the market go from here? 

Stocks are on the expensive side right now in the very short term.  We aren’t predicting a downturn and the markets may even keep rising from here, but the odds of a decline have risen.  Investors are very optimistic and it’s very cheap to hedge a portfolio, so maybe some downside protection is wise here. 

The Corona cases remain the key - rising cases and further shutdowns will weigh on the markets.  But the opposite is true, too.  However, we think it’s unlikely the press will let the hype down before the election.  There’s the potential for a lot of bad news out there, real or not.


This commentary is for informational purposes and is not investment advice, an indicator of future performance, a solicitation, an offer to buy or sell, or a recommendation for any security. It should not be used as a primary basis for making investment decisions. Consider your own financial circumstances and goals carefully before investing. Past performance cannot guarantee results.

Wednesday, July 1, 2020

Commentary for the month ending 6-30-20

Hello all – we hope you had a nice June.

Stocks started the month off on a strong note, but reversed course and trended lower into July.  For the month, the Dow rose 1.7%, the S&P gained 1.8%, and the Nasdaq, which has a higher concentration of tech companies, was higher by a solid 6.0%.


The month also capped the best quarter for the markets in decades as they rebounded off their Coronavirus lows.  The Dow had its best quarter since 1987 with a return of nearly 18%, the S&P, its best since 1999 with a 20% gain.  The Nasdaq is up an astounding 30% for its best quarter since 1999. 


Volatility picked up this month as Coronavirus fears picked up, too.  


______


It was all about the Coronavirus this month.  As the amount of cases picked up, the market took its turn lower. 


It wasn’t like the sharp drop after the Coronavirus first appeared in February – this month’s decline was much less dramatic.  This was likely due to the cases being largely among the younger demographic and the severity is much lower.  The death rate continues to fall and the virus doesn’t look as scary as was once portrayed. 


The market isn’t focusing so much on the number of cases, either – it’s the shutdowns.  Economic data has been improving as economies reopen and new lockdowns throw the recovery into question.  So far, the new shutdowns have been limited but have the potential to grow.

Apparently this is the culprit:


And this is not:


One activity is encouraged to continue, the other was shut down.  Go figure. 
______


The Fed is also very important to the market.  They’re printing tons of money as stimulus and this money makes its way into the markets and pushes them higher.

They held a policy meeting this month and noted they were “not even thinking about thing about” raising interest rates and pulling back on the stimulus.  It looks like they’re keeping the pedal to the metal.

They’re even printing money to buy individual corporate bonds, which keeps borrowing rates low for companies.  But that’s a very slippery slope – how do they decide which bonds to buy, since its essentially the government picking winners and losers?

We’re in uncharted waters when it comes to Central Bank interventions and we don’t think it will end well.

We saw this picture and thought it pretty accurately showed the Fed’s policy (the man pictured is Jay Powell, the head of the Fed):


______


Econ data improved significantly this month.  This isn’t surprising as the economy was shut down and is now opening back up, so the data will obviously look better as a result.

Well, actually the economic data has been surprising to economists.  There is an indicator we follow called the Citi Economic Surprise Index, which tracks how economic data is coming in relative to forecasts.  If the data beats the forecast, it’s a positive, and vice-versa. 

As you can see in the chart below, economic data has been far stronger than economists had predicted and this indicator is at a record high.  This is a good leading indicator for the market. 


Sales at businesses are getting back to normal.  Retail sales saw their biggest monthly increase ever.


Durable goods sales, which are products with a longer life, like a wash machine or phone, also saw a massive jump. 


The positive economic reports have raised GDP estimates for the quarter.  Although it will still be a massively negative number, at least we’re trending the right direction. 


One thing to keep an eye on is employment data. Employment had been improving nicely but is appearing to level off.  New shutdowns are likely to see weekly unemployment figures worsen again. 


Lastly, one indicator we like to look at is the ‘dining out’ statistics.  The level of people dining out is a pretty good leading indicator for the economy.  The data below comes from OpenTable, which is an online reservation company.  As you can see, that industry is improving, too.


______


Where does the market go from here? 

Stocks actually look oversold (cheap) on a very short term basis and we think there’s greater odds of a rise from here.  We’re cautious looking out a little longer – it feels like speculation is rising and this typically happens at tops.  We aren’t selling at this time, but will likely do some hedging down the road.

Also, it will be critical to keep an eye on the Coronavirus cases.  Rising cases or more shutdowns will weigh on the markets.  There’s the potential for a lot of bad news out there.


This commentary is for informational purposes and is not investment advice, an indicator of future performance, a solicitation, an offer to buy or sell, or a recommendation for any security. It should not be used as a primary basis for making investment decisions. Consider your own financial circumstances and goals carefully before investing. Past performance cannot guarantee results.

Monday, June 1, 2020

Commentary for the period ending 5-31-20

Hello all – we hope you had a nice May.

Stocks continued to rebound off the lows from the Coronavirus shutdown.  For the month, the Dow rose 4.3%, the S&P gained 4.5%, and the Nasdaq, which has more tech companies, was higher by 6.8%.

The S&P has now rebounded 35% off the March lows and is about 11% below its all-time high. 


Volatility is also continuing to trend lower. 


_____


The month was fairly quiet, especially compared to the last few months. 

Most importantly, there weren’t any new developments with the Coronavirus that would cause us to worry – in fact, things appear to be moving in the right direction. 

The amount of cases continues to decline:


And the decline comes amid an increase in testing, which could lead to an increase in cases.  In fact, the amount of positive tests is declining, which is a great sign.


_____


The Fed continues to be a major factor in the market rise with their aggressive stimulus. 

We’ve seen over the last decade how the Fed’s stimulus can push markets higher, regardless of the underlying conditions of the economy or corporate earnings.  They’ve taken their stimulus to an aggressive new level now, which is bound to have at least some impact on the market. 

Comments from Fed Chairman Jay Powell on 60 Minutes earlier this month showed how aggressive they are willing to be:
We’re not out of ammunition by a long shot. No, there’s, there’s really no limit to what we can do with these lending programs that we have…there’s a lot more we can do. We’ve done what we can as we go. But I will say that we’re not out of ammunition by a long shot. No, there’s really no limit to what we can do with these lending programs that we have. So there’s a lot more we can do to support the economy, and we’re committed to doing everything we can as long as we need to.

These comments show the Fed will continue to prop up the markets and sent stocks higher as a result. 

We believe the printing of trillions and trillions of dollars now will cause a massive hangover later.  When that will come remains anyone’s guess, so it looks like the party will continue in the meantime.

_____


Economic data released this month was bad – and not surprising. 

Forecasts for GDP this quarter, which shows the strength of the economy, continue to decline. 


We have to keep in mind that these economic reports are all backwards-looking.  We know the economy came to a standstill and this will cause the data to look terrible.

However, the economy is gradually reopening and the data will improve. 

Data coming in now shows that people are getting back to work.  Weekly jobless claims (which counts the amount of new people who filed for unemployment) continues to improve.


And the amount of people who continue to be on unemployment is also turning the right direction. 


The vast majority of layoffs were only temporary, according to the Labor Department.  Their analysis can be seen in the chart below.


Finally, this last chart shows how people are spending again.  First Data Merchant Services is a payment technology company that processes over $2 trillion every year.  Their data shows a clear uptick in spending as we emerge from this self-induced coma.


_____


Where does the market go from here? 

We think the market will continue higher as we emerge from the shutdown.  However, a reemergence of the virus will obviously be a negative.

In the short-term, most of the indicators we follow show the market being on the overvalued side (or expensive).  We wouldn’t be surprised to see the market take a pause here, or at least climb a little bit slower.  We’d be very surprised to see a large, fast rise or fall at this time. 

There will still be tough times ahead, too.  A wave of bankruptcies is likely and economic data will probably be the worst we’ve ever seen.  There will be plenty of negative headlines that could send the market lower, so caution is always warranted.      


This commentary is for informational purposes and is not investment advice, an indicator of future performance, a solicitation, an offer to buy or sell, or a recommendation for any security. It should not be used as a primary basis for making investment decisions. Consider your own financial circumstances and goals carefully before investing. Past performance cannot guarantee results.